Remote debug your iisnode hosted node.js app
I recently came across iisnode’s built in support for the excellent node-inspector package. My iisnode host of choice being AppHarbor, I proceeded to set up a repo and make sure it all works there.
The good news is… It does!
Even better is that this is built straight into iisnode, you don’t need to touch your app code to get it working, you don’t even need to install the node-inspector package. It is all bundled in with iisnode.
You simply need to make a single change to your web.config rewrite rules so that the urls to launch the debugger are not treated as regular requests and sent through to you app.
<configuration>
  <system.webServer>
    <handlers>
      <add name="iisnode" path="app.js" verb="*" modules="iisnode" />
    </handlers>
    <iisnode loggingEnabled="false" debuggingEnabled="true" debuggerPathSegment="debug" />
    <rewrite>
      <rules>
        <clear />
        <rule name="Debug" patternSyntax="Wildcard" stopProcessing="true">
          <match url="app.js/debug*" />
          <conditions logicalGrouping="MatchAll" trackAllCaptures="false" />
          <action type="None" />
        </rule>
        <rule name="app" patternSyntax="Wildcard">
          <match url="*" negate="false" />
          <conditions logicalGrouping="MatchAll" trackAllCaptures="false" />
          <action type="Rewrite" url="app.js" />
        </rule>
      </rules>
    </rewrite>
  </system.webServer>
</configuration>
So the way you get to the debug console is to hit up /app.js/debug where app.js is the entry point for your app. The rewrite rules here simply allow that url through as it is, everything else gets handed off to the app as normal.
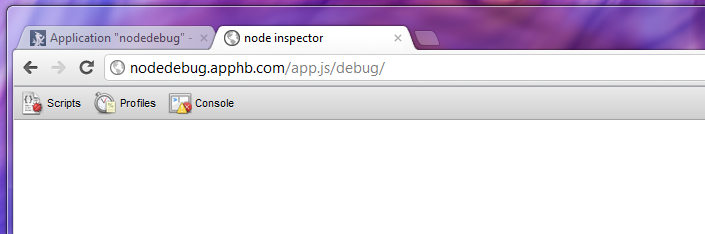
So push up the modified web.config, hit the URL and this nice console pops up.
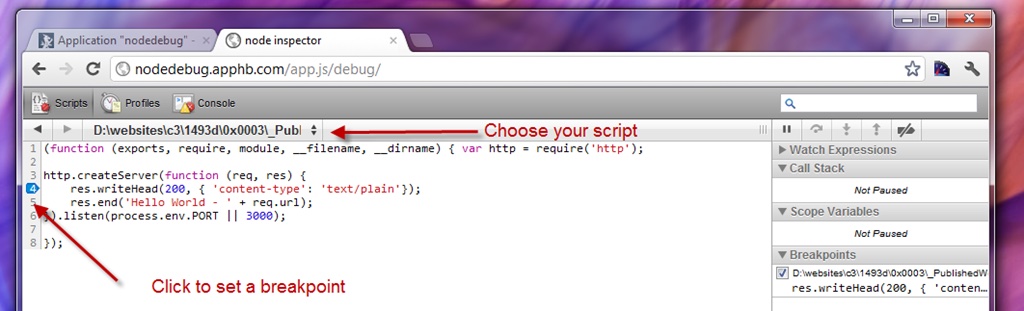
Clicking into Scripts presents you with a list of all the running JavaScript files on the server. Including those built into node itself. You can pick the file you want to debug, and set a break point by clicking on the line numbers.
With the breakpoint set, now you need to fire a hit off to the website that will run over the breakpoint.
This hit will sit there waiting for the server to respond, switch back to your debugger page and the breakpoint has been reached and is waiting for you to take some action.
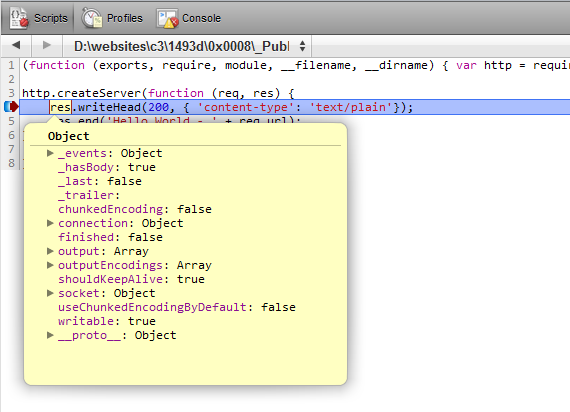
As you can see you have full variable inspection, the options to step through line by line or continue running, variable watch and all the sorts of things you would expect. You even have mouse hover variable inspection like in Visual Studio.
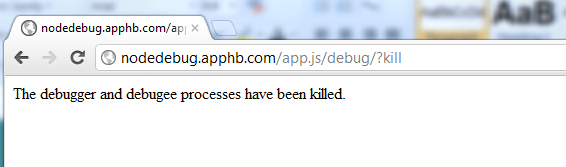
When you are done debugging, you should call the /app.js/debug/?kill url which will shut down the debugger process.
Now I wouldn’t go doing this on production, and you certainly do not want to leave that route in place, I would set the debuggingEnabled property to false as well in production but for development or staging servers where you need to follow something through, this is simply awesome.